Less Anxiety: How to Correctly Interpret Hurricane Forecasts
Most people look at a hurricane forecast map and see danger. A pilot or ship's captain looks at the same map and sees probabilities. Once you learn to read it their way, the anxiety disappears.
The way to read a hurricane forecast is the way a pilot or ship's captain reads it — not as a threat assessment, but as a probability calculation. The question is never "is there a storm?" but "what are the odds, and what do they mean for my specific situation?" Once you learn to read the National Hurricane Center's graphics this way, the colors on the map stop being alarming and start being informative.
The primary source of qualified and up-to-date hurricane information is the National Hurricane Center of the United States: nhc.noaa.gov. On the homepage you will find a map with markers for every active weather system at the moment you open the site. It is updated continuously throughout hurricane season.
Reading the NHC Charts — A Practical Example
We use Hurricane Jerry in September 2019 as our working example. The charts and methodology are identical for every storm, every season — nothing has changed in how the NHC presents this information, so the example remains fully current.
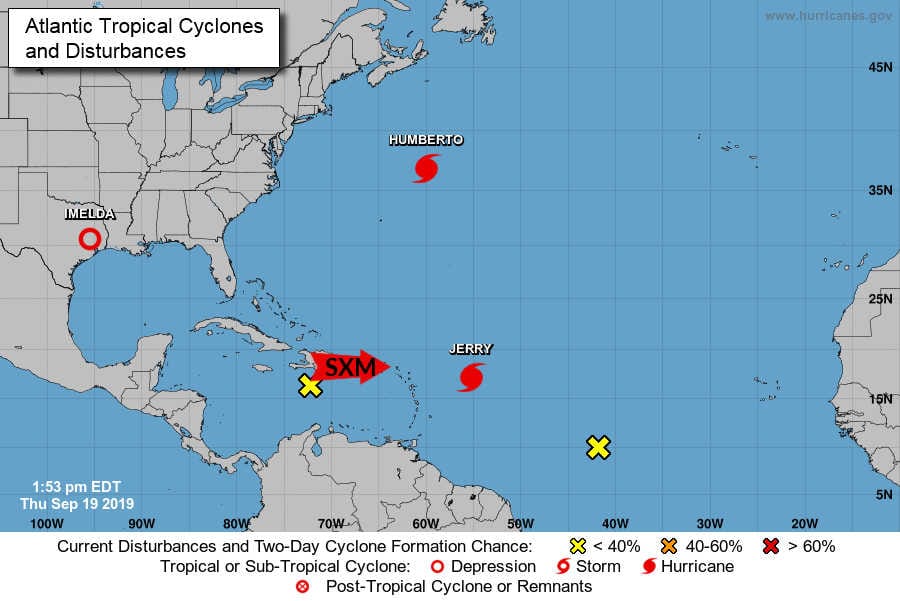
On the NHC homepage, click on the name of the storm you want to follow — in this case, Jerry. A page opens with detailed information about that specific weather system. Select the Graphics tab, then choose the option for wind speed probabilities.
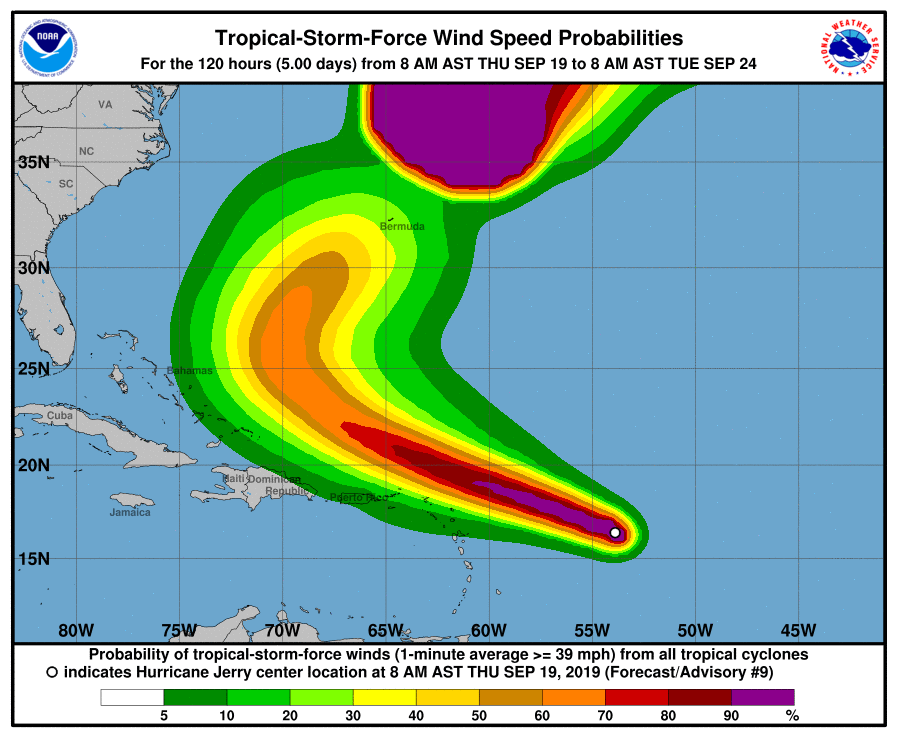
At first glance, the colors on this chart look alarming. Read the legend at the bottom before drawing any conclusions.
In this image, Sint Maarten sits in a green zone — marked as having a 20 to 30% chance of experiencing tropical-storm-force winds. Now reverse that number, the way a pilot would: there is a 70 to 80% probability that Sint Maarten will not experience a storm. The chart that looked frightening is actually saying the island is more likely than not to be fine.
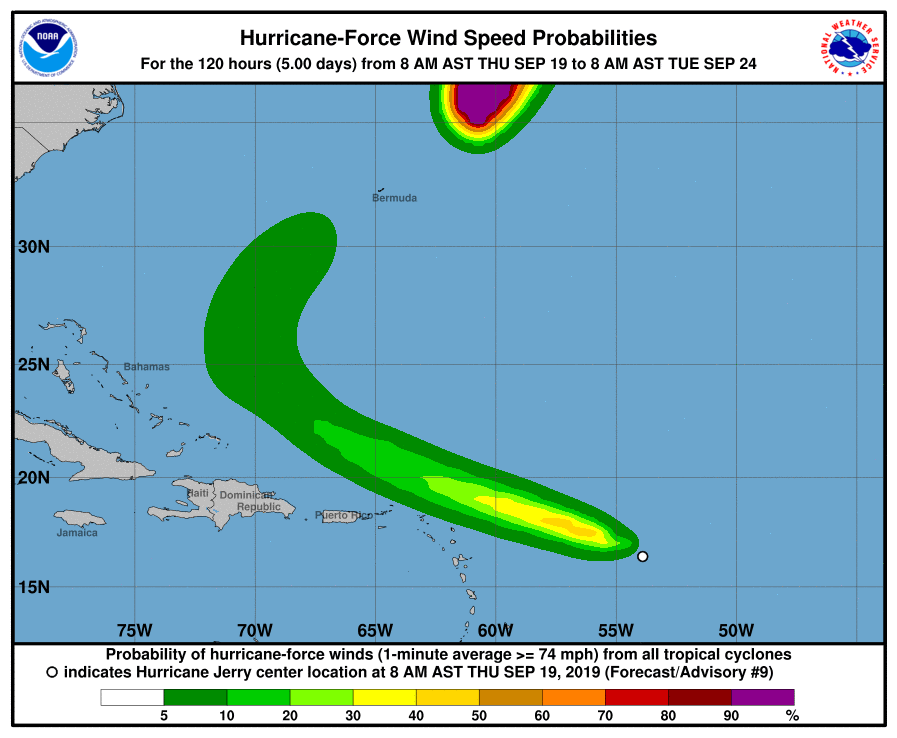
The next chart shows the probability of experiencing an actual hurricane. In this forecast, Sint Maarten sits outside the danger zone entirely. Zero probability of a direct hurricane strike.
The Conclusion a Professional Draws
From these two charts, a pilot or captain reading Hurricane Jerry on September 19, 2019 would conclude: there is a small chance of strong wind, and no meaningful probability of a hurricane. That is the complete picture. The island prepares sensibly, monitors the situation, and does not panic.
This is not purely theoretical. In 1995, Hurricane Luis made a direct hit on Sint Maarten — one of the most destructive storms in the island's history. In 2017, Hurricane Irma followed. In both cases, experienced skippers on the island — myself included — read the developing patterns days in advance and knew these were going to be direct hits. Not from official advisories, but from watching how the systems were moving, reading the Discussion tabs, and applying the same probability analysis described in this article. Eight hurricanes later, the methodology has not changed.
The Most Useful Tab Nobody Reads
If you want to develop a real feel for how a storm system is likely to behave over the coming days, open the Discussion tab on the NHC storm page.
Here, the meteorologist on duty writes in a scientifically more relaxed manner — expressing what might be described as professional gut feeling about what is actually going to happen. The Discussion tab is where the forecaster's genuine assessment lives, in language that is more candid than the official public advisory. It often offers considerably more insight than the formal forecast for anyone willing to read it carefully.
Follow a storm through its Discussion tab for two or three days and you will develop an intuitive understanding of how these systems develop, stall, accelerate, and weaken. It is the difference between reading the headline and reading the analysis.
Hurricane Season Context for Sint Maarten
Sint Maarten sits in the northeastern Caribbean, which places it in the path of Atlantic hurricane systems tracking westward from the African coast. Hurricane season runs from June 1 to November 30, with peak activity in August through October.
Hurricane Jerry passed close enough to Sint Maarten to look alarming in the media coverage. The island experienced some wind and rain. That is exactly what the probability charts predicted — and exactly what a professional reading of those charts would have told you to expect.
Read the charts. Reverse the numbers. Check the Discussion. Make informed decisions.